A KPI in real estate marketing is a quantifiable metric that tells you whether your marketing dollars and effort are producing measurable business results. As of 2026, agents who track the right KPIs consistently outperform those who rely on gut instinct or anecdotal feedback. The five most important KPIs for real estate marketers are conversion rate, website visits, organic search traffic, cost per lead, and referral rate. Each one measures a different dimension of your marketing performance, and together they give you a complete diagnostic view of what is working, what is not, and where to invest next. This guide breaks down each KPI with definitions, formulas, benchmarks, and the specific actions you should take when the numbers move in the wrong direction.
Key Takeaways
- Conversion rate is the single most telling KPI because it connects marketing activity directly to lead capture and client acquisition.
- Website visits split into new versus returning users reveal whether your marketing is generating reach or building loyalty, two distinct problems with different fixes.
- Organic search traffic is the highest-intent, lowest-cost traffic source for most real estate websites in 2026, making it worth tracking separately from total visits.
- Cost per lead tells you the economic efficiency of every paid campaign and lets you compare channels on equal footing.
- Referral rate measures the strength of your post-closing relationships and is the leading indicator of long-term, compounding business growth.
- Tracking KPIs without acting on them is the same as not tracking them at all. Pair every metric with a written action plan and a monthly review cadence.
The 5 Real Estate Marketing KPIs That Matter Most in 2026
Most agents spend money on marketing. Fewer agents measure what that money produces. The gap between spending and measuring is where budgets get wasted, campaigns get repeated without improvement, and competitors quietly pull ahead. The framework below gives you five KPIs that cover the full marketing funnel, from first impression to closed referral. Track all five and you will know exactly where your marketing is strong and where it needs work.
1. Conversion rate
Conversion rate is the percentage of visitors who complete a desired action on a specific page or ad. It is calculated as: (Number of conversions / Number of visitors) x 100.
This is the most versatile KPI on the list because “conversion” can mean different things depending on the context. On a property website landing page, a conversion might be a form submission requesting a showing. On an email campaign, it might be a click to a listing page. On a paid ad, it might be a phone call or a lead form completion. The formula stays the same. Only the definition of “desired action” changes.
Here is how to calculate it for a property page: divide the number of people who contacted you about the listing by the total number of people who visited that page during a set time period. If 400 people visited a listing page in one month and 12 submitted a contact form, your conversion rate is 3%.
Real estate website conversion rates vary by page type and traffic source. Pages receiving organic search traffic tend to convert at higher rates than pages receiving cold paid traffic because organic visitors are actively searching for what you offer. According to the National Association of Realtors, 96% of home buyers in 2025 used online tools during their home search (NAR, 2025). That means nearly every potential client will interact with your digital presence before they ever call you. Your conversion rate tells you how many of those interactions turn into actual conversations.
That connection between conversion rate and cost per lead is worth pausing on. Improving your conversion rate by even one percentage point can cut your cost per lead significantly without increasing your ad spend by a single dollar. This is why conversion rate belongs at the top of the list.
2. Website visits
Website visits measure the total number of sessions on your real estate website during a given period. This KPI is tracked in Google Analytics 4 (GA4) under the “Sessions” metric.
Your website is the hub of your online presence. It is where your ads drive traffic, where your listings live, and where potential clients decide whether to contact you. Measuring how many people visit your site tells you whether your marketing is generating attention. But the raw number alone is not enough. You need to split it into two categories.
New users tell you how many people your marketing is reaching for the first time. A declining new user count signals a reach problem. The fix is to invest more in social media marketing, search engine optimization, or paid campaigns.
Returning users tell you whether your content is compelling enough to bring people back. A low returning user count signals a content quality problem. The fix is to audit your top pages and add more specific, locally relevant information that gives visitors a reason to bookmark your site.
To put these numbers in context, Albuquerque-based brokerage R1 Companies achieved website traffic 80% above NAR benchmarks after investing in a structured content and SEO strategy (Source: Luxury Presence Case Study: R1 Companies, 2024). That kind of gap between an agent who tracks and acts on web visit data versus one who does not is the difference between a website that generates business and one that sits idle.
3. Organic search traffic
Organic search traffic is the number of website visits that come from unpaid search engine results. It is tracked in GA4 under the “Organic Search” channel grouping and in Google Search Console under “Clicks.”
If SEO is part of your marketing strategy, this KPI deserves its own line item separate from total web visits. Organic traffic represents people who are actively searching for what you offer. They typed a query into Google, your page appeared, and they clicked. That is high-intent behavior, and it costs you nothing per click once the content is ranking.
Breaking your traffic sources into channels (organic, paid, social, direct, referral) inside GA4 reveals which of your marketing efforts are producing visits and which are not. Many agents discover that one channel drives 70% or more of their traffic while others contribute almost nothing. That insight alone can redirect thousands of dollars in annual spend.
To improve organic search traffic, focus on three areas:
- Content quality: Publish pages that answer the specific questions buyers and sellers in your market are searching for. Neighborhood guides, market reports, and school district breakdowns rank well because they match local search intent.
- Technical performance: Work with website specialists to confirm that your site loads in under three seconds on mobile and passes Google’s Core Web Vitals assessment. Slow load times and poor mobile experiences directly lower your search rankings (Google Search Central, 2026).
- Video and multimedia: Adding video content to property pages and neighborhood guides increases average time on page, which is a positive signal for organic search performance.
That distinction matters. Organic leads arrive with intent already built in. They searched, they found you, and they chose to click. Paid leads often need more nurturing before they convert. Tracking organic search traffic separately lets you see how much of your pipeline is being fed by high-intent visitors versus cold traffic.
4. Cost per lead
Cost per lead (CPL) is the total amount spent on a marketing campaign divided by the number of leads that campaign generated. It is calculated as: Total campaign spend / Number of leads captured.
Regardless of how many people follow you on Instagram or how many views your latest video received, the purpose of real estate marketing is to generate leads for your real estate business. CPL tells you how efficiently your budget is doing that job.
Here is an illustrative example: if you run a paid ad campaign for $500 and collect 37 leads through a form that captures email addresses and phone numbers, your cost per lead is $13.51. Actual CPL varies widely by market, platform, and campaign quality.
Real campaigns can see CPL shift dramatically with refinement. One agent reported dropping their cost per lead from $17 to $4 through campaign adjustments, a reduction that fundamentally changes the economics of lead generation. The lesson: CPL is not a fixed number. It is a number you can improve by testing ad creative, refining audience targeting, and improving landing page conversion rates.
To get the most from this KPI, calculate CPL separately for each channel. Your Google Ads CPL, your Meta Ads CPL, your email campaign CPL, and your organic content CPL (measured as the cost of content production divided by leads generated) will all be different. Comparing them side by side tells you where your next dollar should go.
5. Referral rate
Referral rate is the percentage of your total clients who refer new business to you. It is calculated as: (Number of clients who made a referral / Total number of clients) x 100.
A lead that comes to you through a referral converts at a significantly higher rate than a cold lead from a paid ad. The reason is trust. Real estate transactions are among the largest financial decisions most people will ever make. A personal recommendation from a friend or family member removes the trust barrier that cold marketing has to work much harder to overcome.
When one of your past clients tells a friend about you, that friend arrives pre-sold on your credibility. They are more likely to sign a listing agreement, more likely to follow your pricing guidance, and more likely to refer someone else after their own transaction closes. Referrals compound.
Calculate your referral rate by dividing the number of clients who referred someone to you by your total client count over a given period. If you closed 30 transactions last year and 9 of those clients sent you a referral, your referral rate is 30%.
If your referral rate is low, the problem is almost always a post-closing communication gap. Clients forget about you because you stopped showing up after the deal closed. Fix this by building a post-closing nurture sequence: quarterly check-in emails, home anniversary messages, local market updates, and periodic personal notes. Tools like lead nurture marketing can maintain these touchpoints at scale without requiring hours of manual effort each week. Nothing sends without your approval, but the system keeps your name in front of past clients so you are the first person they mention when someone asks for a real estate recommendation.
Real Estate Marketing KPI Comparison Table
Use this reference table to keep all five KPIs, their formulas, and their corresponding actions in one place.
| KPI | Definition | Formula | What it tells you | Primary improvement action |
| Conversion rate | Percentage of visitors who complete a desired action | (Conversions / Visitors) x 100 | Whether your pages and ads are turning attention into leads | A/B test headlines, CTAs, and form placement |
| Website visits | Total sessions on your website in a given period | Tracked in GA4 under Sessions | Whether your marketing is generating attention | Split into new vs. returning users and address each separately |
| Organic search traffic | Visits from unpaid search engine results | Tracked in GA4 under Organic Search channel | How much high-intent traffic your SEO is producing | Publish locally relevant content and fix technical site issues |
| Cost per lead | Amount spent per lead captured from a campaign | Total spend / Number of leads | The economic efficiency of each marketing channel | Compare CPL across channels and shift budget to the lowest-cost sources |
| Referral rate | Percentage of clients who refer new business to you | (Referring clients / Total clients) x 100 | The strength of your post-closing relationships | Build a post-closing nurture sequence with regular touchpoints |
Taking Action on Your Real Estate KPIs in 2026
Tracking KPIs without acting on them is no different from not tracking them at all. The numbers only matter if they change your behavior. Here is a three-part framework for turning your KPI data into real marketing improvements.
Create a written action plan for every underperforming metric
When a KPI drops below your target, write down three things: what the number is, what you want it to be, and the specific change you will make to close the gap. Vague intentions like “improve our ads” do not count. A written action plan looks like this: “Our listing page conversion rate dropped from 3.2% to 1.8% this month. Target: 3.0%. Action: Replace the current hero image with a professional twilight photo and move the contact form above the fold by Friday.”
Run A/B tests before making permanent changes
An A/B test (also called a split test) compares two versions of a page, ad, or email to see which one performs better. Instead of guessing whether a new headline will improve your conversion rate, run both versions simultaneously and let the data decide. Most ad platforms and email marketing tools have built-in A/B testing features. Use them before committing to any major creative change.
Review your KPIs on a monthly cadence
Set a recurring monthly appointment to review all five KPIs. Pull the numbers, compare them to the prior month, and note any trends. Monthly reviews catch problems early enough to fix them before they cost you significant budget or pipeline. They also reveal positive trends you can double down on. The agents who treat KPI review as a recurring calendar event, not an occasional afterthought, are the ones who compound their results over time.
The additional KPIs you choose to track will depend on the specific goals of your business. If you are investing heavily in short-form video for listings in 2026, tracking video views and engagement rate on those platforms makes sense as a supplementary metric. But the five KPIs above are the foundation. Get those right first.
Case Study: How R1 Companies Improved Every KPI That Matters
Albuquerque-based brokerage R1 Companies provides a clear example of what happens when a real estate business commits to tracking and improving its marketing KPIs. After partnering with Luxury Presence, which powers websites for 30% of the WSJ RealTrends Top 100 agents, R1 Companies invested in a structured content marketing and SEO strategy. The results over the following year tell the story through the exact KPIs covered in this article:
- Organic search traffic: 673% increase in organic website impressions, with the site ranking in the top ten for 5,129 non-branded keywords
- Website visits: Traffic 80% above NAR benchmarks
- Conversion rate and lead volume: 48% increase in engaged leads within six months, reaching 1,200 engaged leads in a single month
- Cost per lead: 79% reduction in marketing costs, saving $317,000 annually
- Engagement: User engagement 30% above NAR benchmarks
None of those results happened by accident. They happened because R1 Companies measured the right things, identified the gaps, and made specific changes to close them. That is the entire point of KPI tracking: not to collect numbers for the sake of collecting numbers, but to use those numbers to make better decisions every month.
FAQs
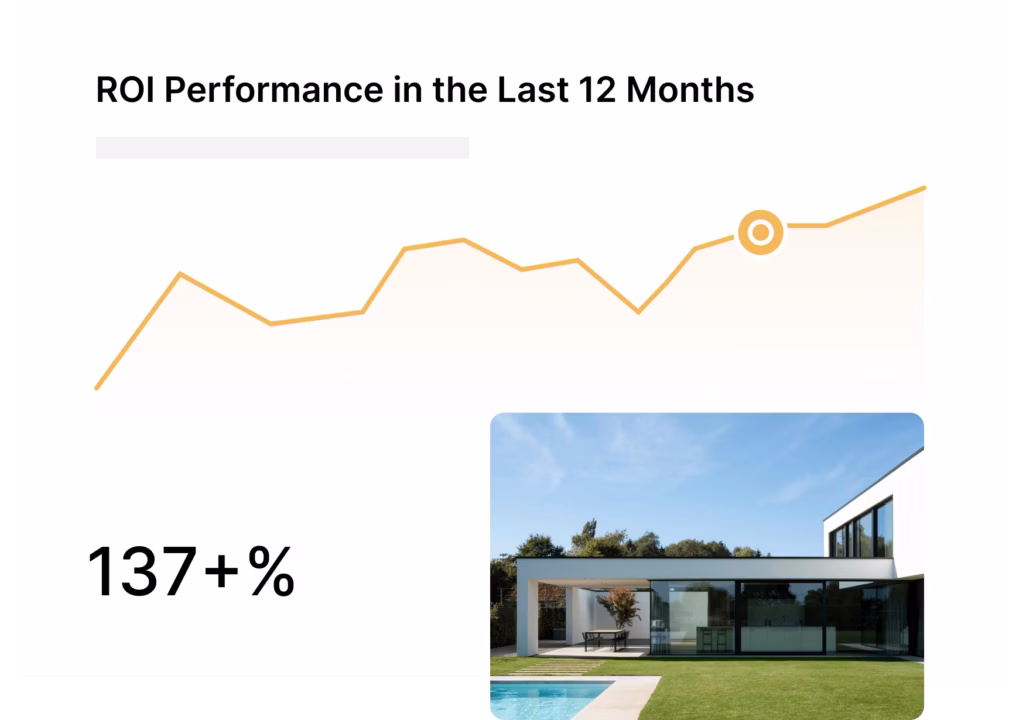
Perfect your budget
Curious about your return on investment when it comes to advertising? Our ROI calculator makes it easy to predict and optimize your campaign performance.
Glossary of terms
- KPI (Key Performance Indicator)
- A quantifiable metric used to evaluate the success of a specific activity against a defined goal.
- Conversion rate
- The percentage of visitors who complete a desired action on a page or ad.
- Cost per lead (CPL)
- The total amount spent on a campaign divided by the number of leads that campaign generated.
- Organic search traffic
- Website visits that come from unpaid search engine results.
- Referral rate
- The percentage of total clients who refer new business to you.
- A/B test (split test)
- A method of comparing two versions of a page, ad, or email to determine which one performs better.
- GA4 (Google Analytics 4)
- Google’s current web analytics platform for tracking website traffic, user behavior, and conversion events.
About the author
Kate Evans is a content marketing strategist at Luxury Presence, the leading growth platform for high-performing real estate professionals. She develops data-driven editorial content and supports SEO strategy and brand voice frameworks that help agents attract qualified leads and establish market authority. Her published work covers topics including CRM strategy, social media marketing, and digital growth, supporting thousands of agents in scaling their businesses through modern marketing.