

We gathered performance data on more than one million real estate professionals across 310 U.S. markets over the past two years. The findings were consistent across markets, price points, and conditions.
If you're trying to understand what separates the agents at the top of their markets from everyone else, here's what the data shows.
The numbers, plainly stated
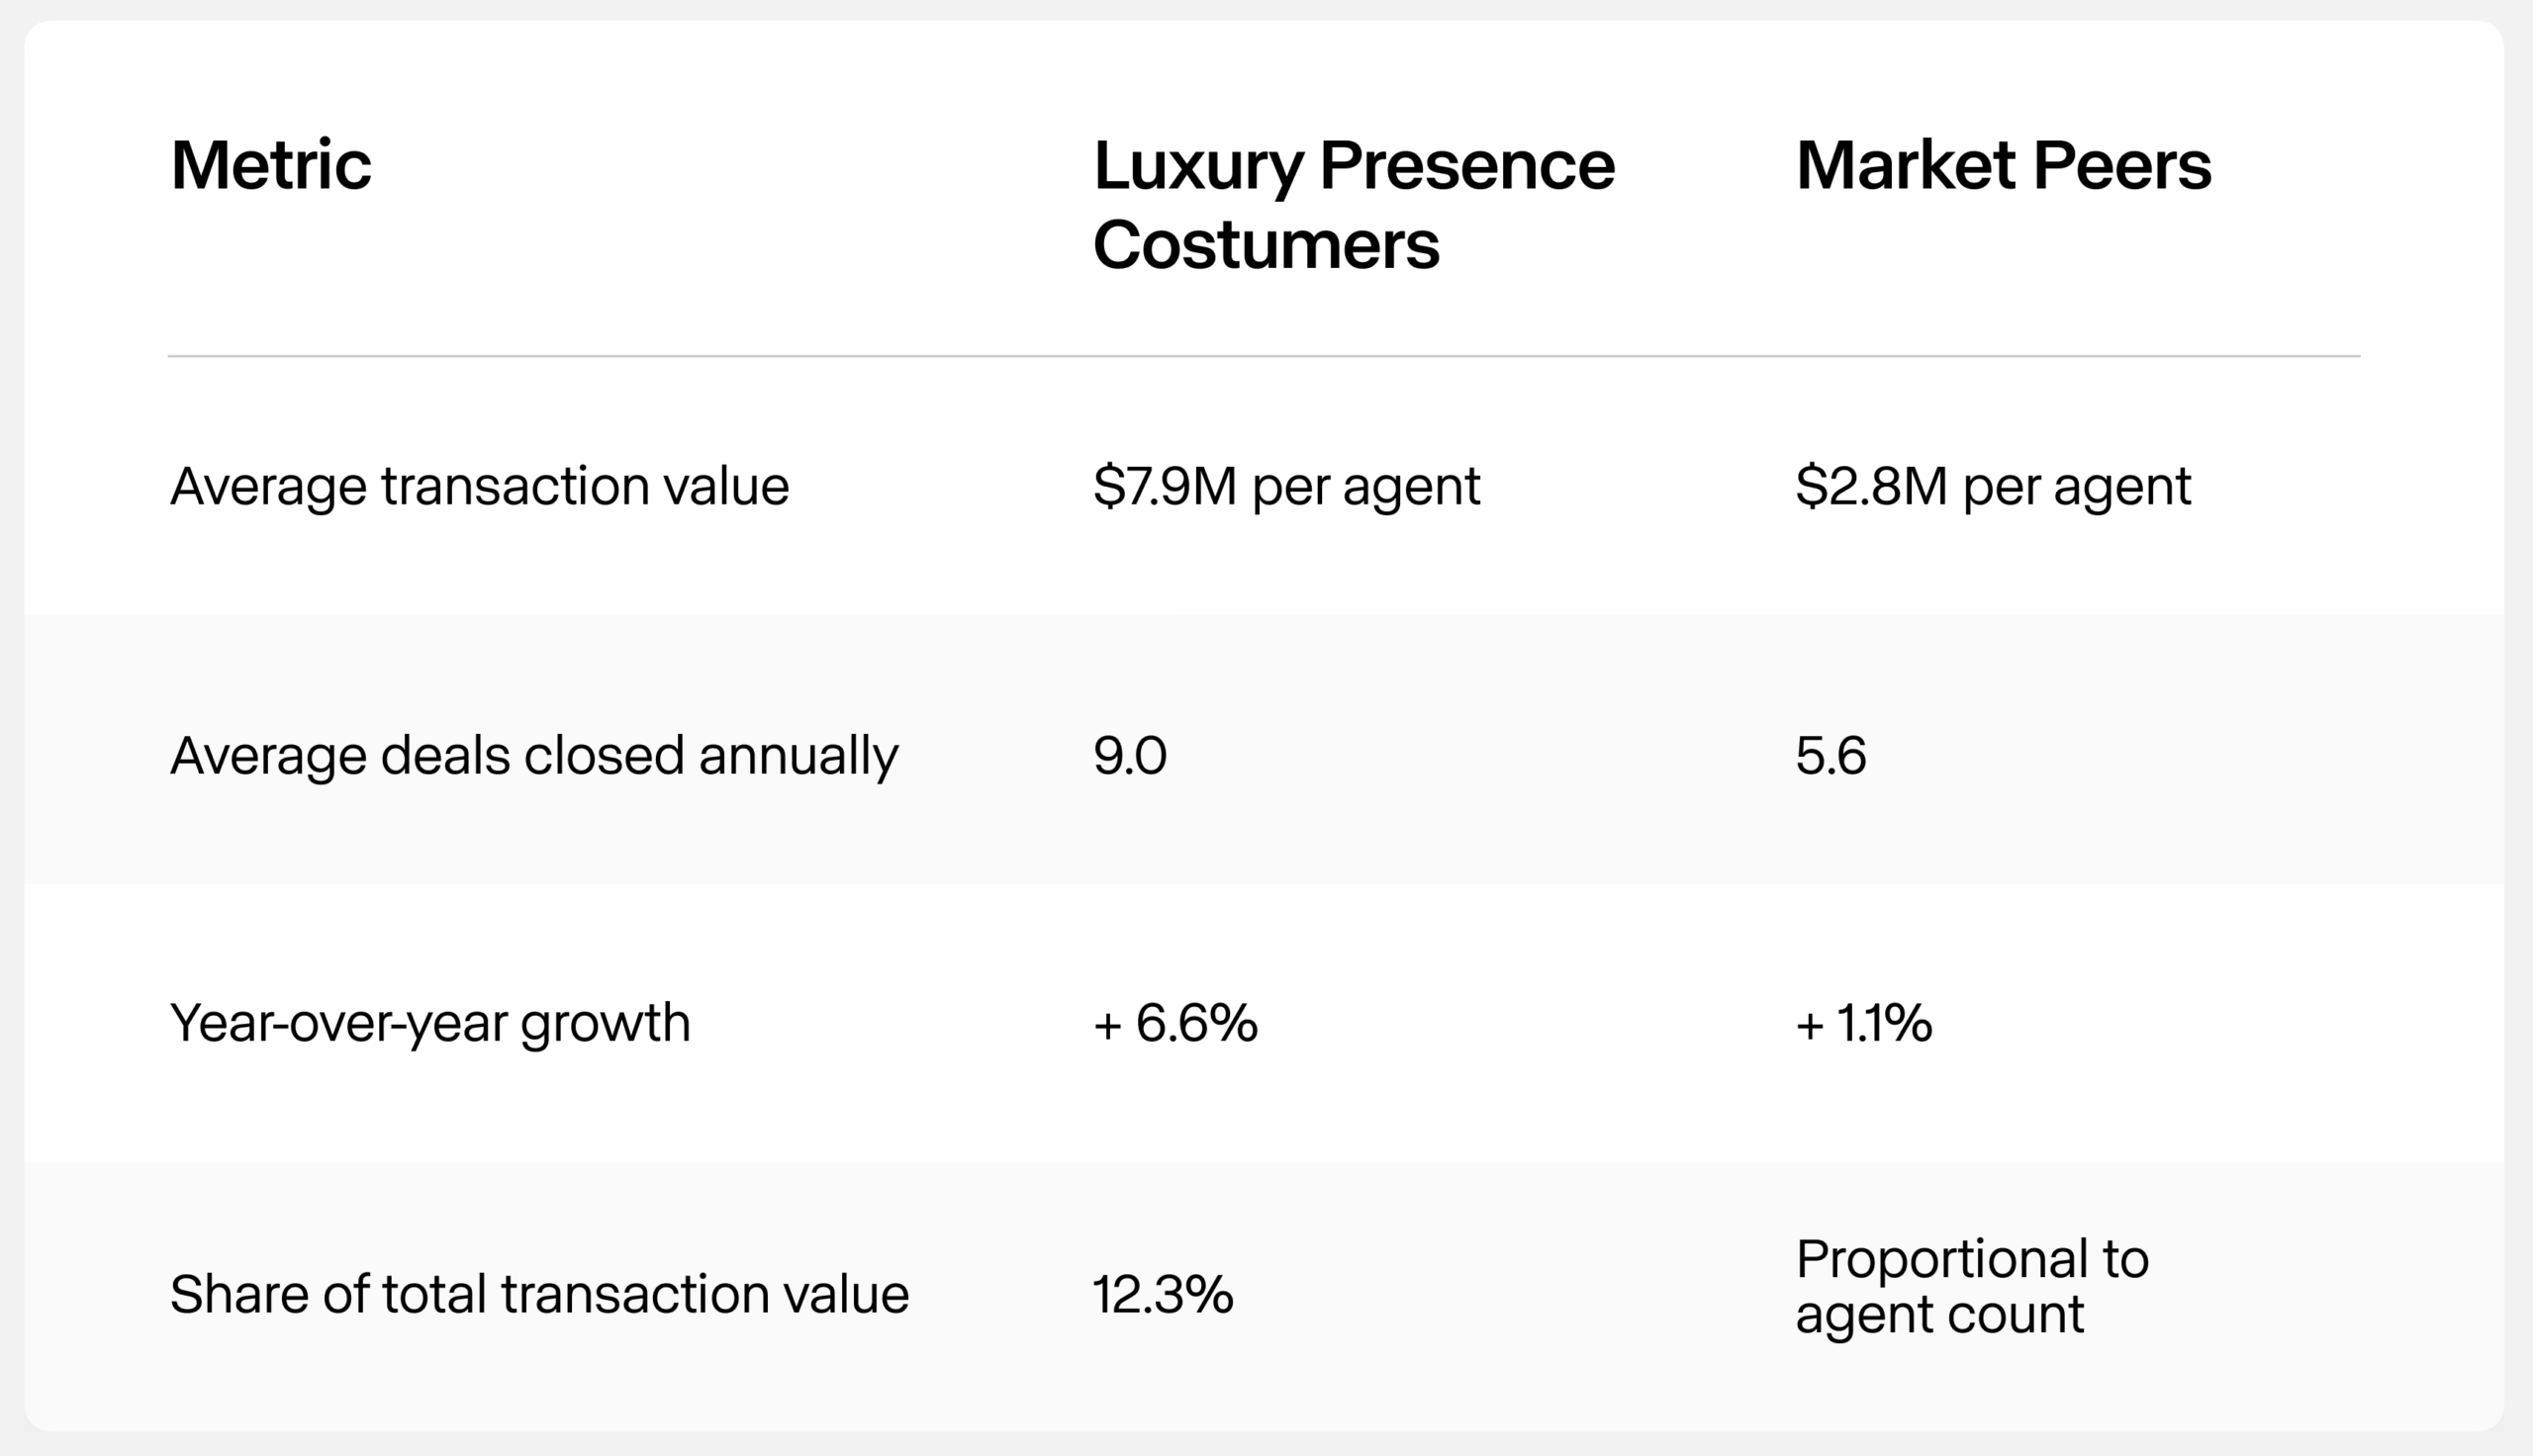
Of the one million-plus agents in this dataset, 53,152 were Luxury Presence customers. We measured their performance against 1,081,483 non-Luxury Presence agents operating in the same metro areas during the same period.
Every comparison is same-market: Luxury Presence customers are measured only against peers in their own city, so geography wouldn't skew the results.
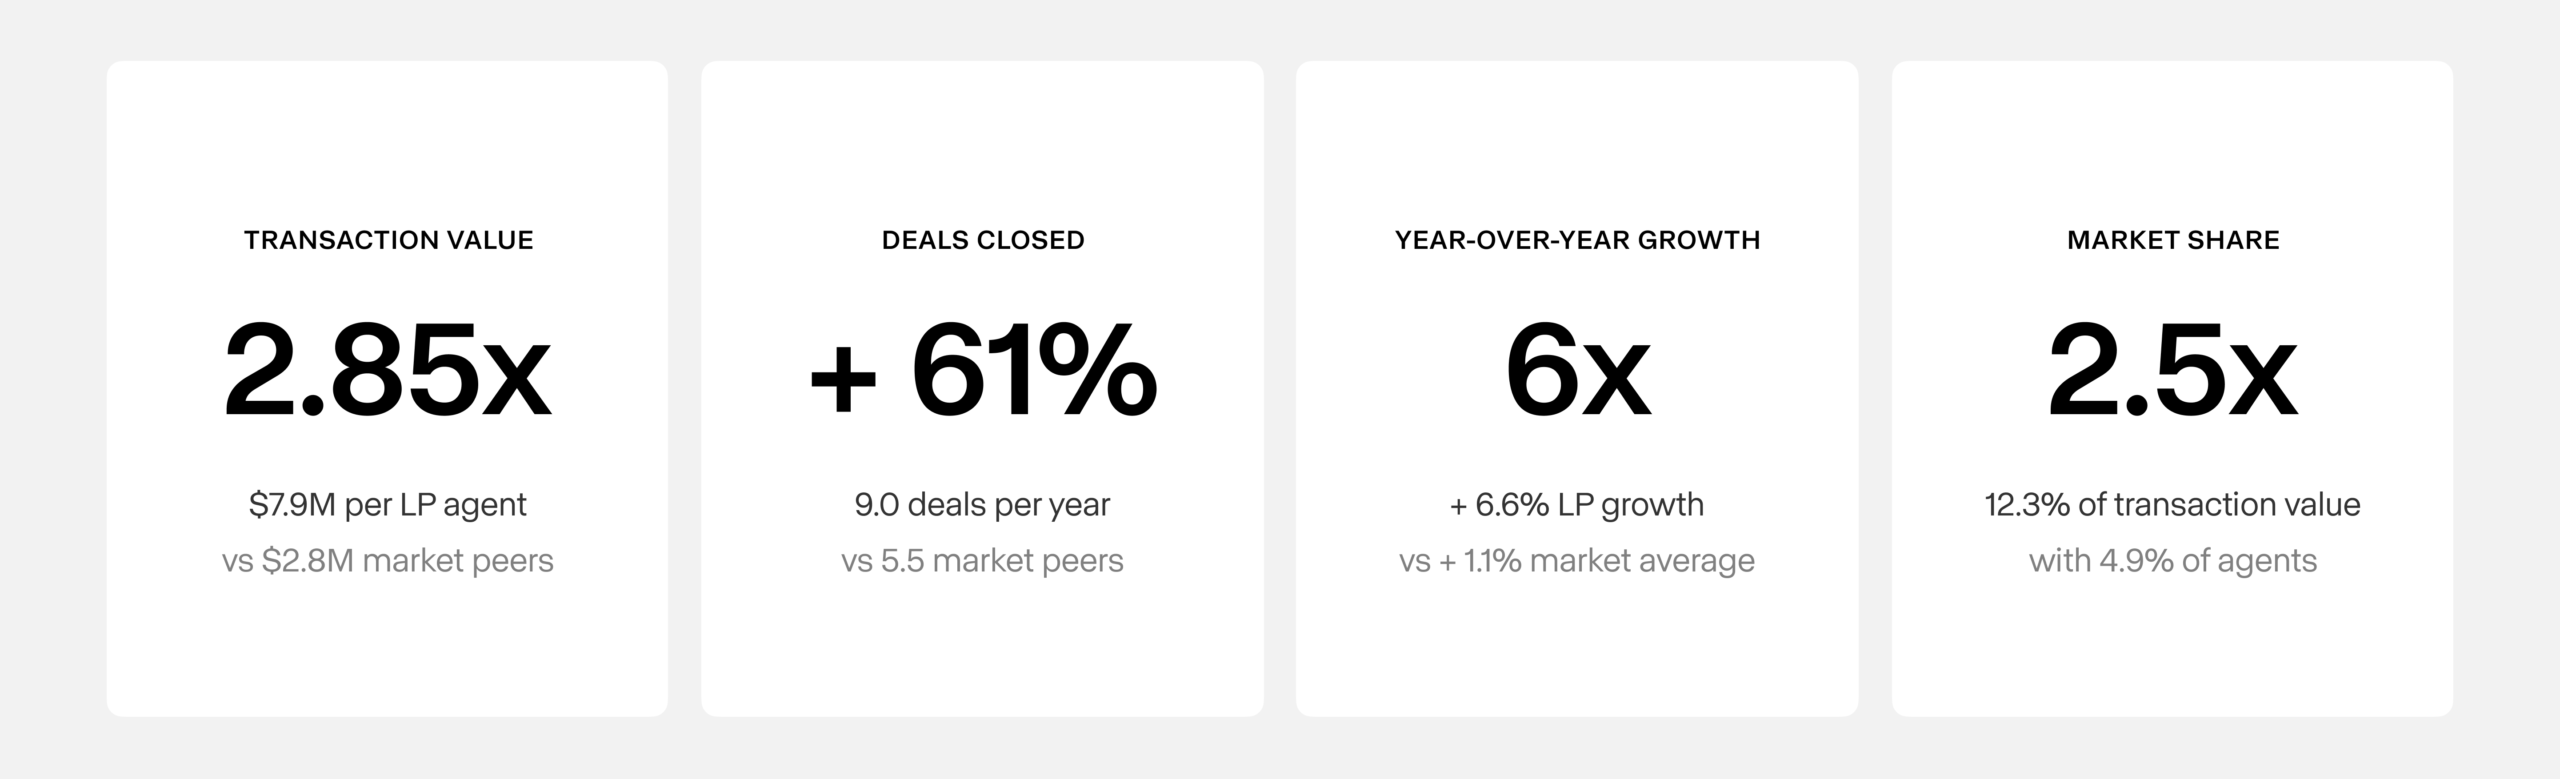
Luxury Presence customers represent less than 5% of the real estate professionals in these markets. They account for more than 12% of all transaction value, a market presence 2.5 times larger than their agent count alone would suggest.
Picture a room of 100 agents. The 5 using Luxury Presence are generating the same transaction value as roughly 12 of their peers.
The transaction value gap, 2.85 times that of peers, is the number worth paying attention to. These agents are winning higher-value transactions, which generates higher commissions, which funds better marketing, which attracts more high-value clients.
What happens when markets soften
Performance numbers in a rising market are easy to generate. The more revealing story is what happens when conditions soften.
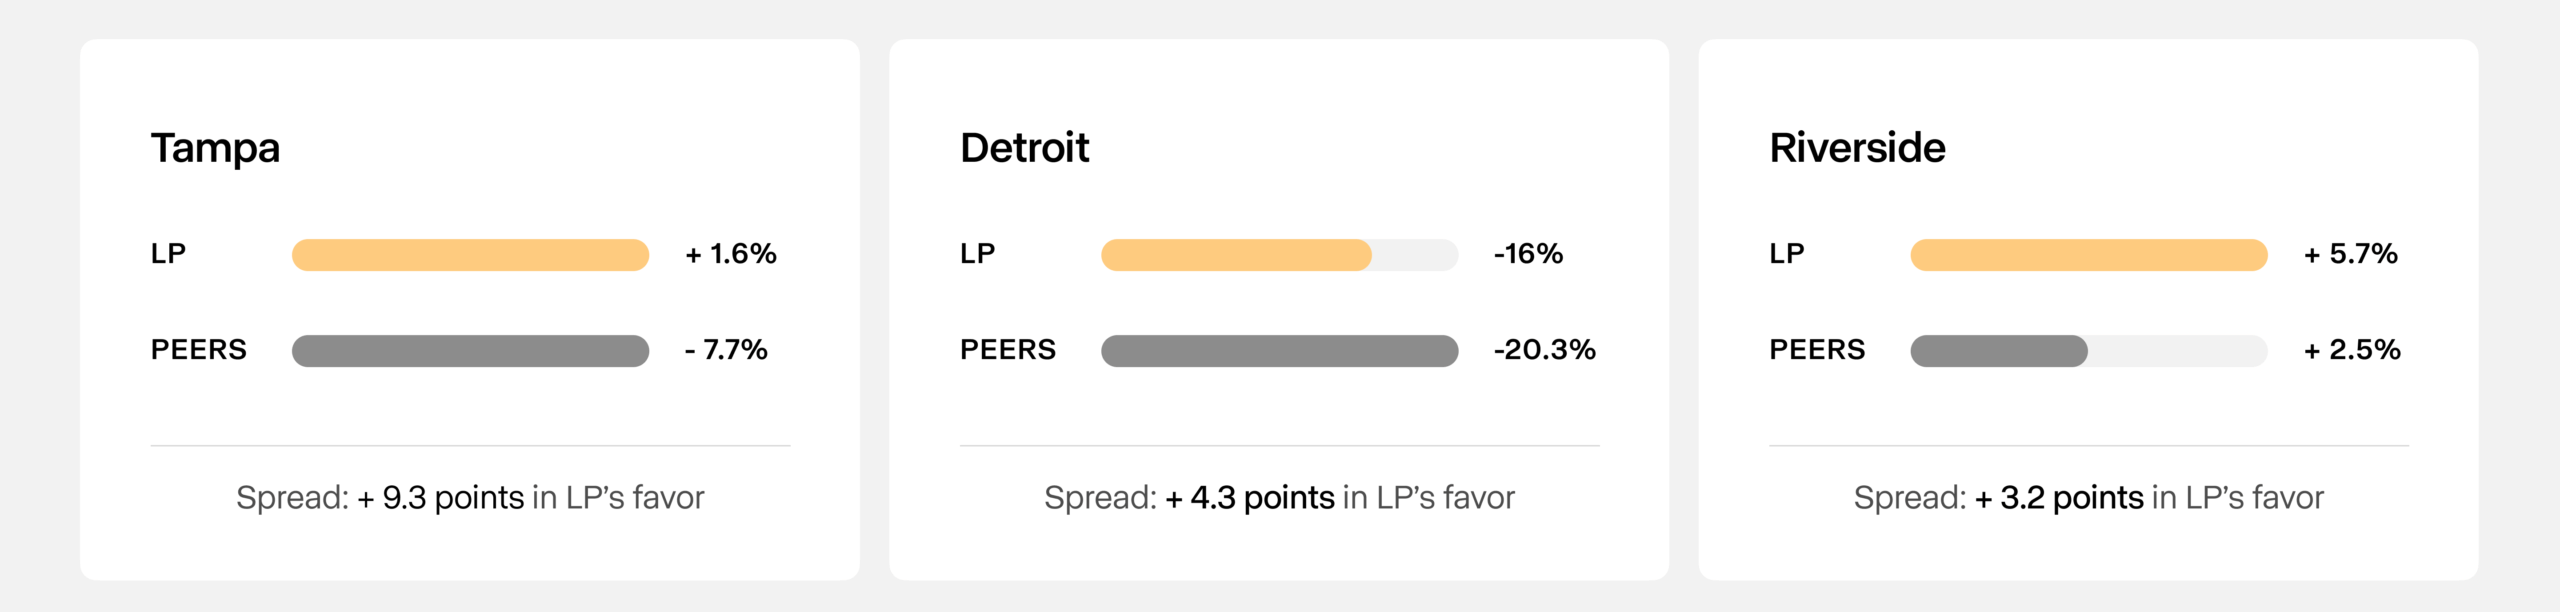
Our analysis covered a period when four major markets saw meaningful declines in transaction volume for the broader agent population. Tampa fell 7.7% and Detroit dropped 20.3%. In both cities, total market activity contracted in ways agents felt immediately.
Luxury Presence clients in those same markets showed up differently.
In Tampa, while the broader market contracted 7.7%, Luxury Presence customers grew transaction value by 1.6%. That's a 9.3-point spread in a tough environment. In Detroit, where the full market fell 20.3%, Luxury Presence customers declined too, but by 16%. A smaller loss, and not by luck.
This is the finding that tells the real story. Anyone can produce growth numbers in a bull market.
Holding ground when volume dries up and agents are competing for a shrinking pool of deals is a different skill entirely, and the pattern here holds across every declining market we analyzed.
Where the gap widens most
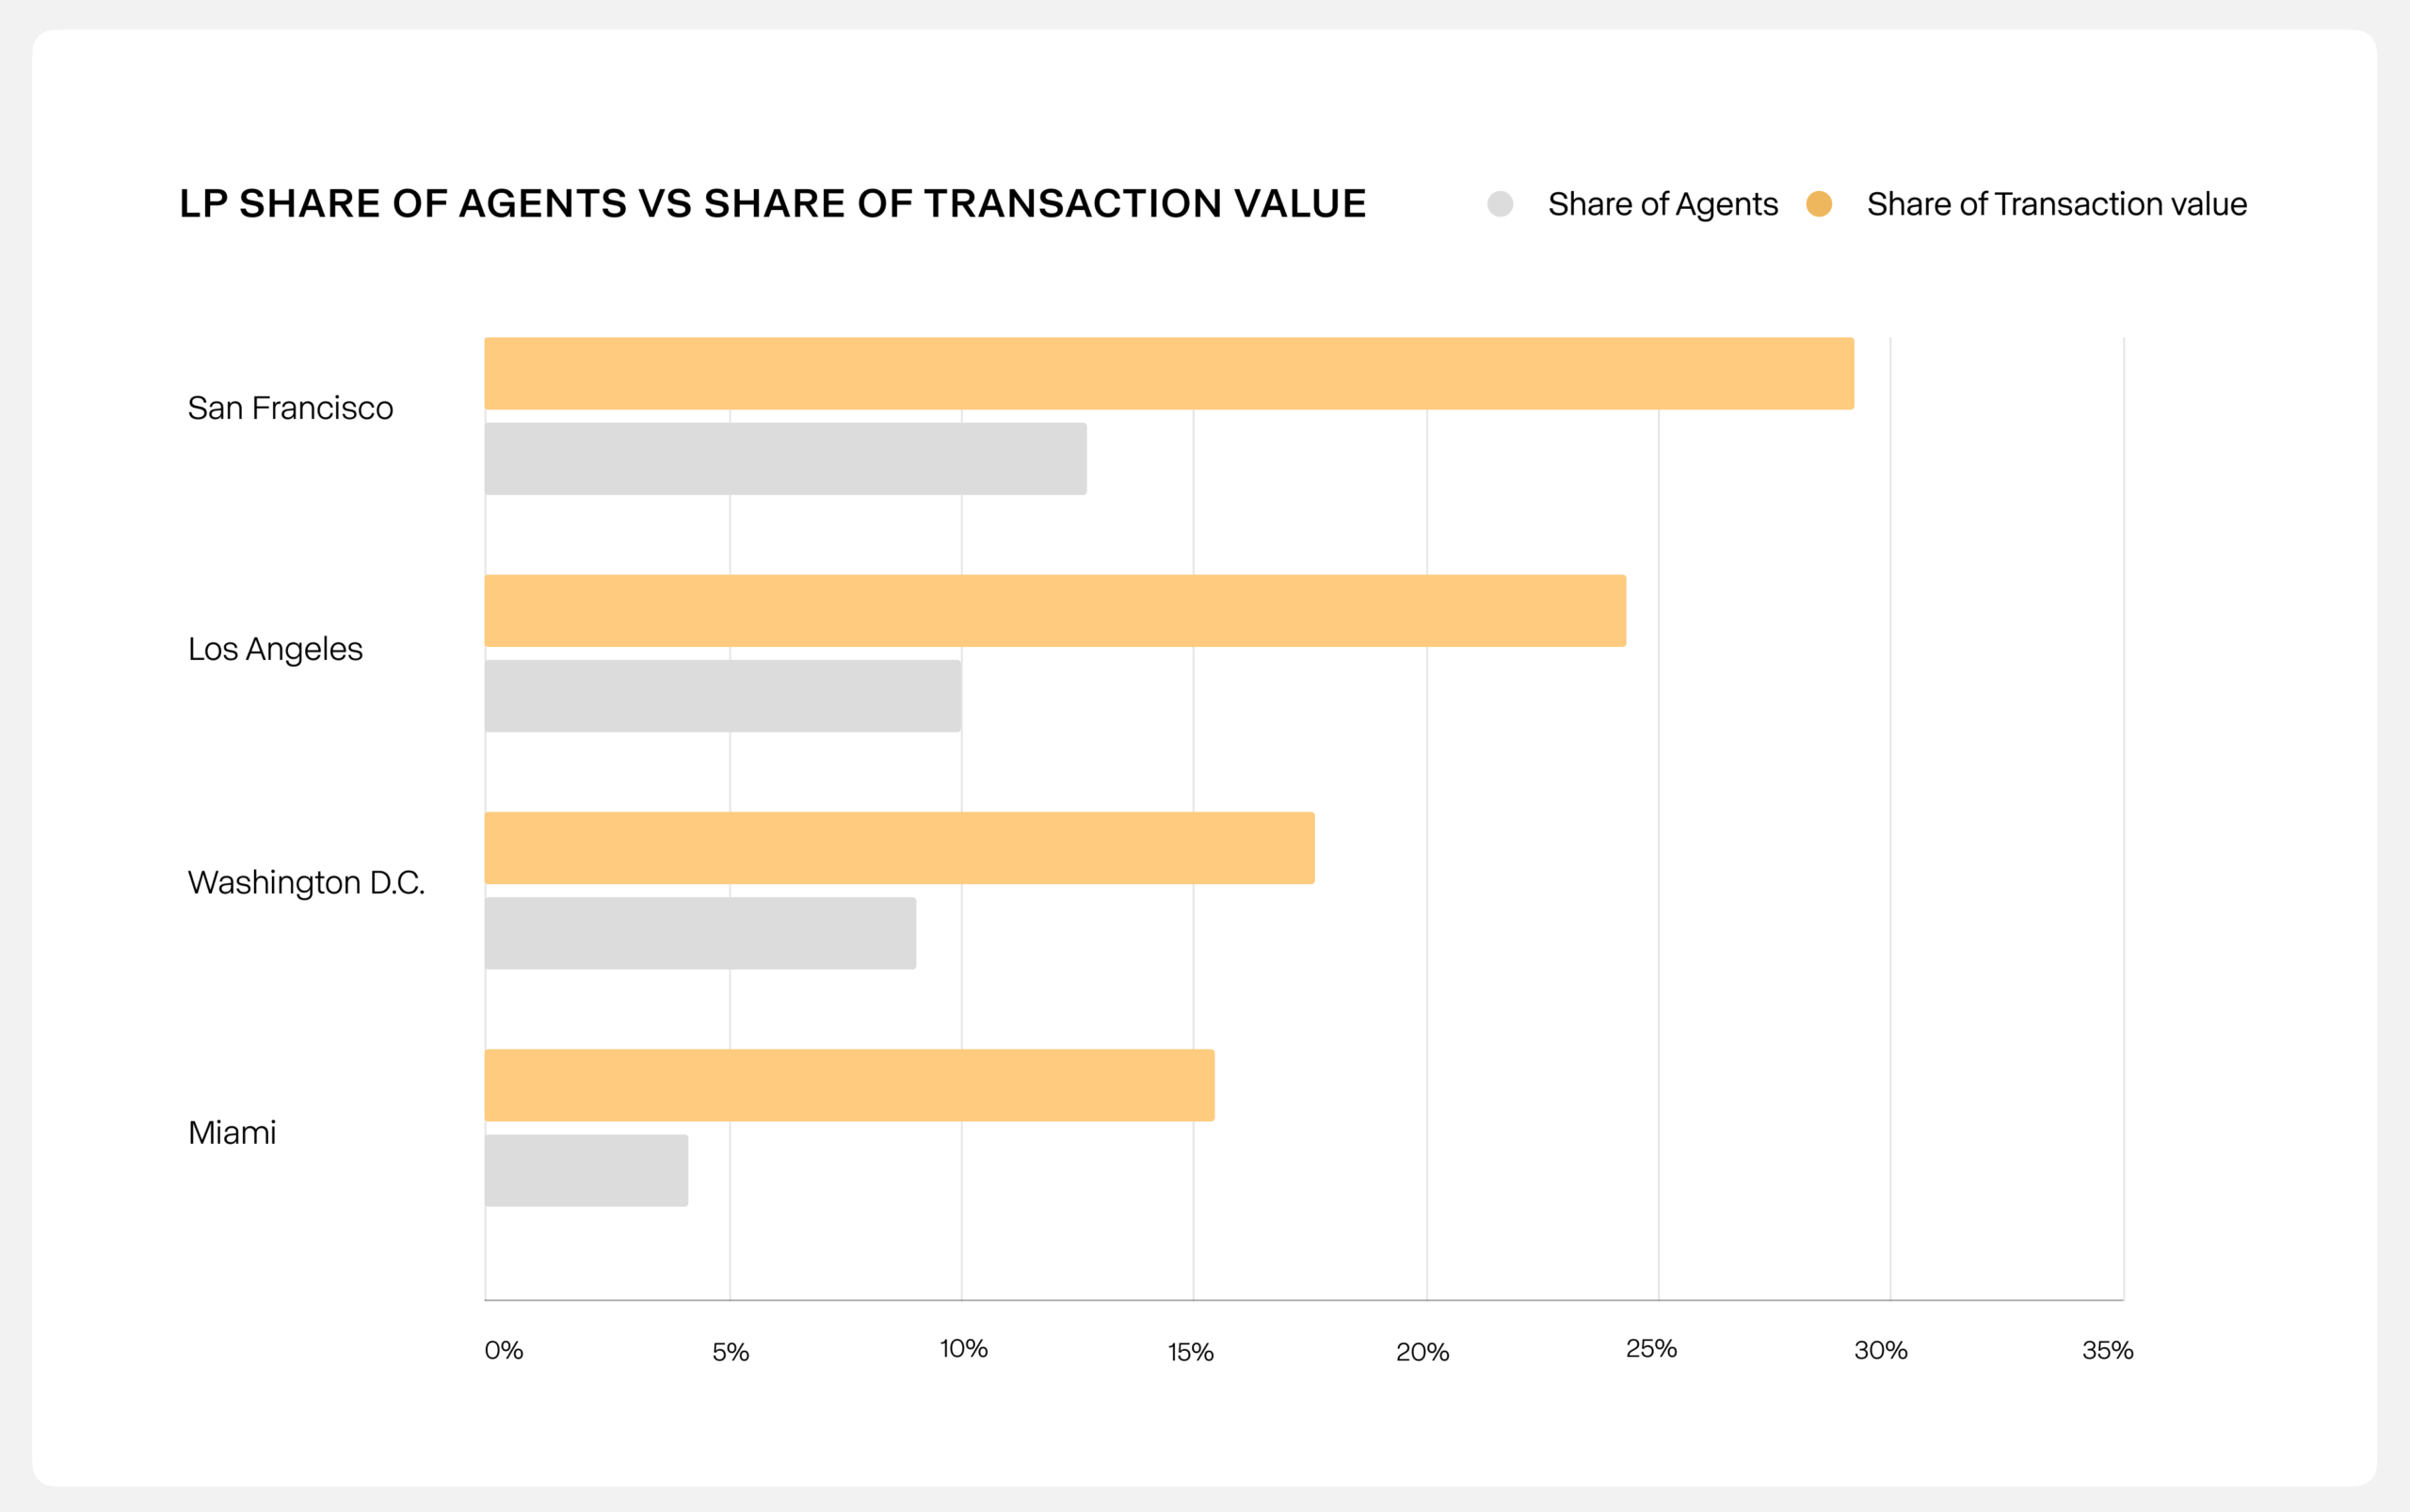
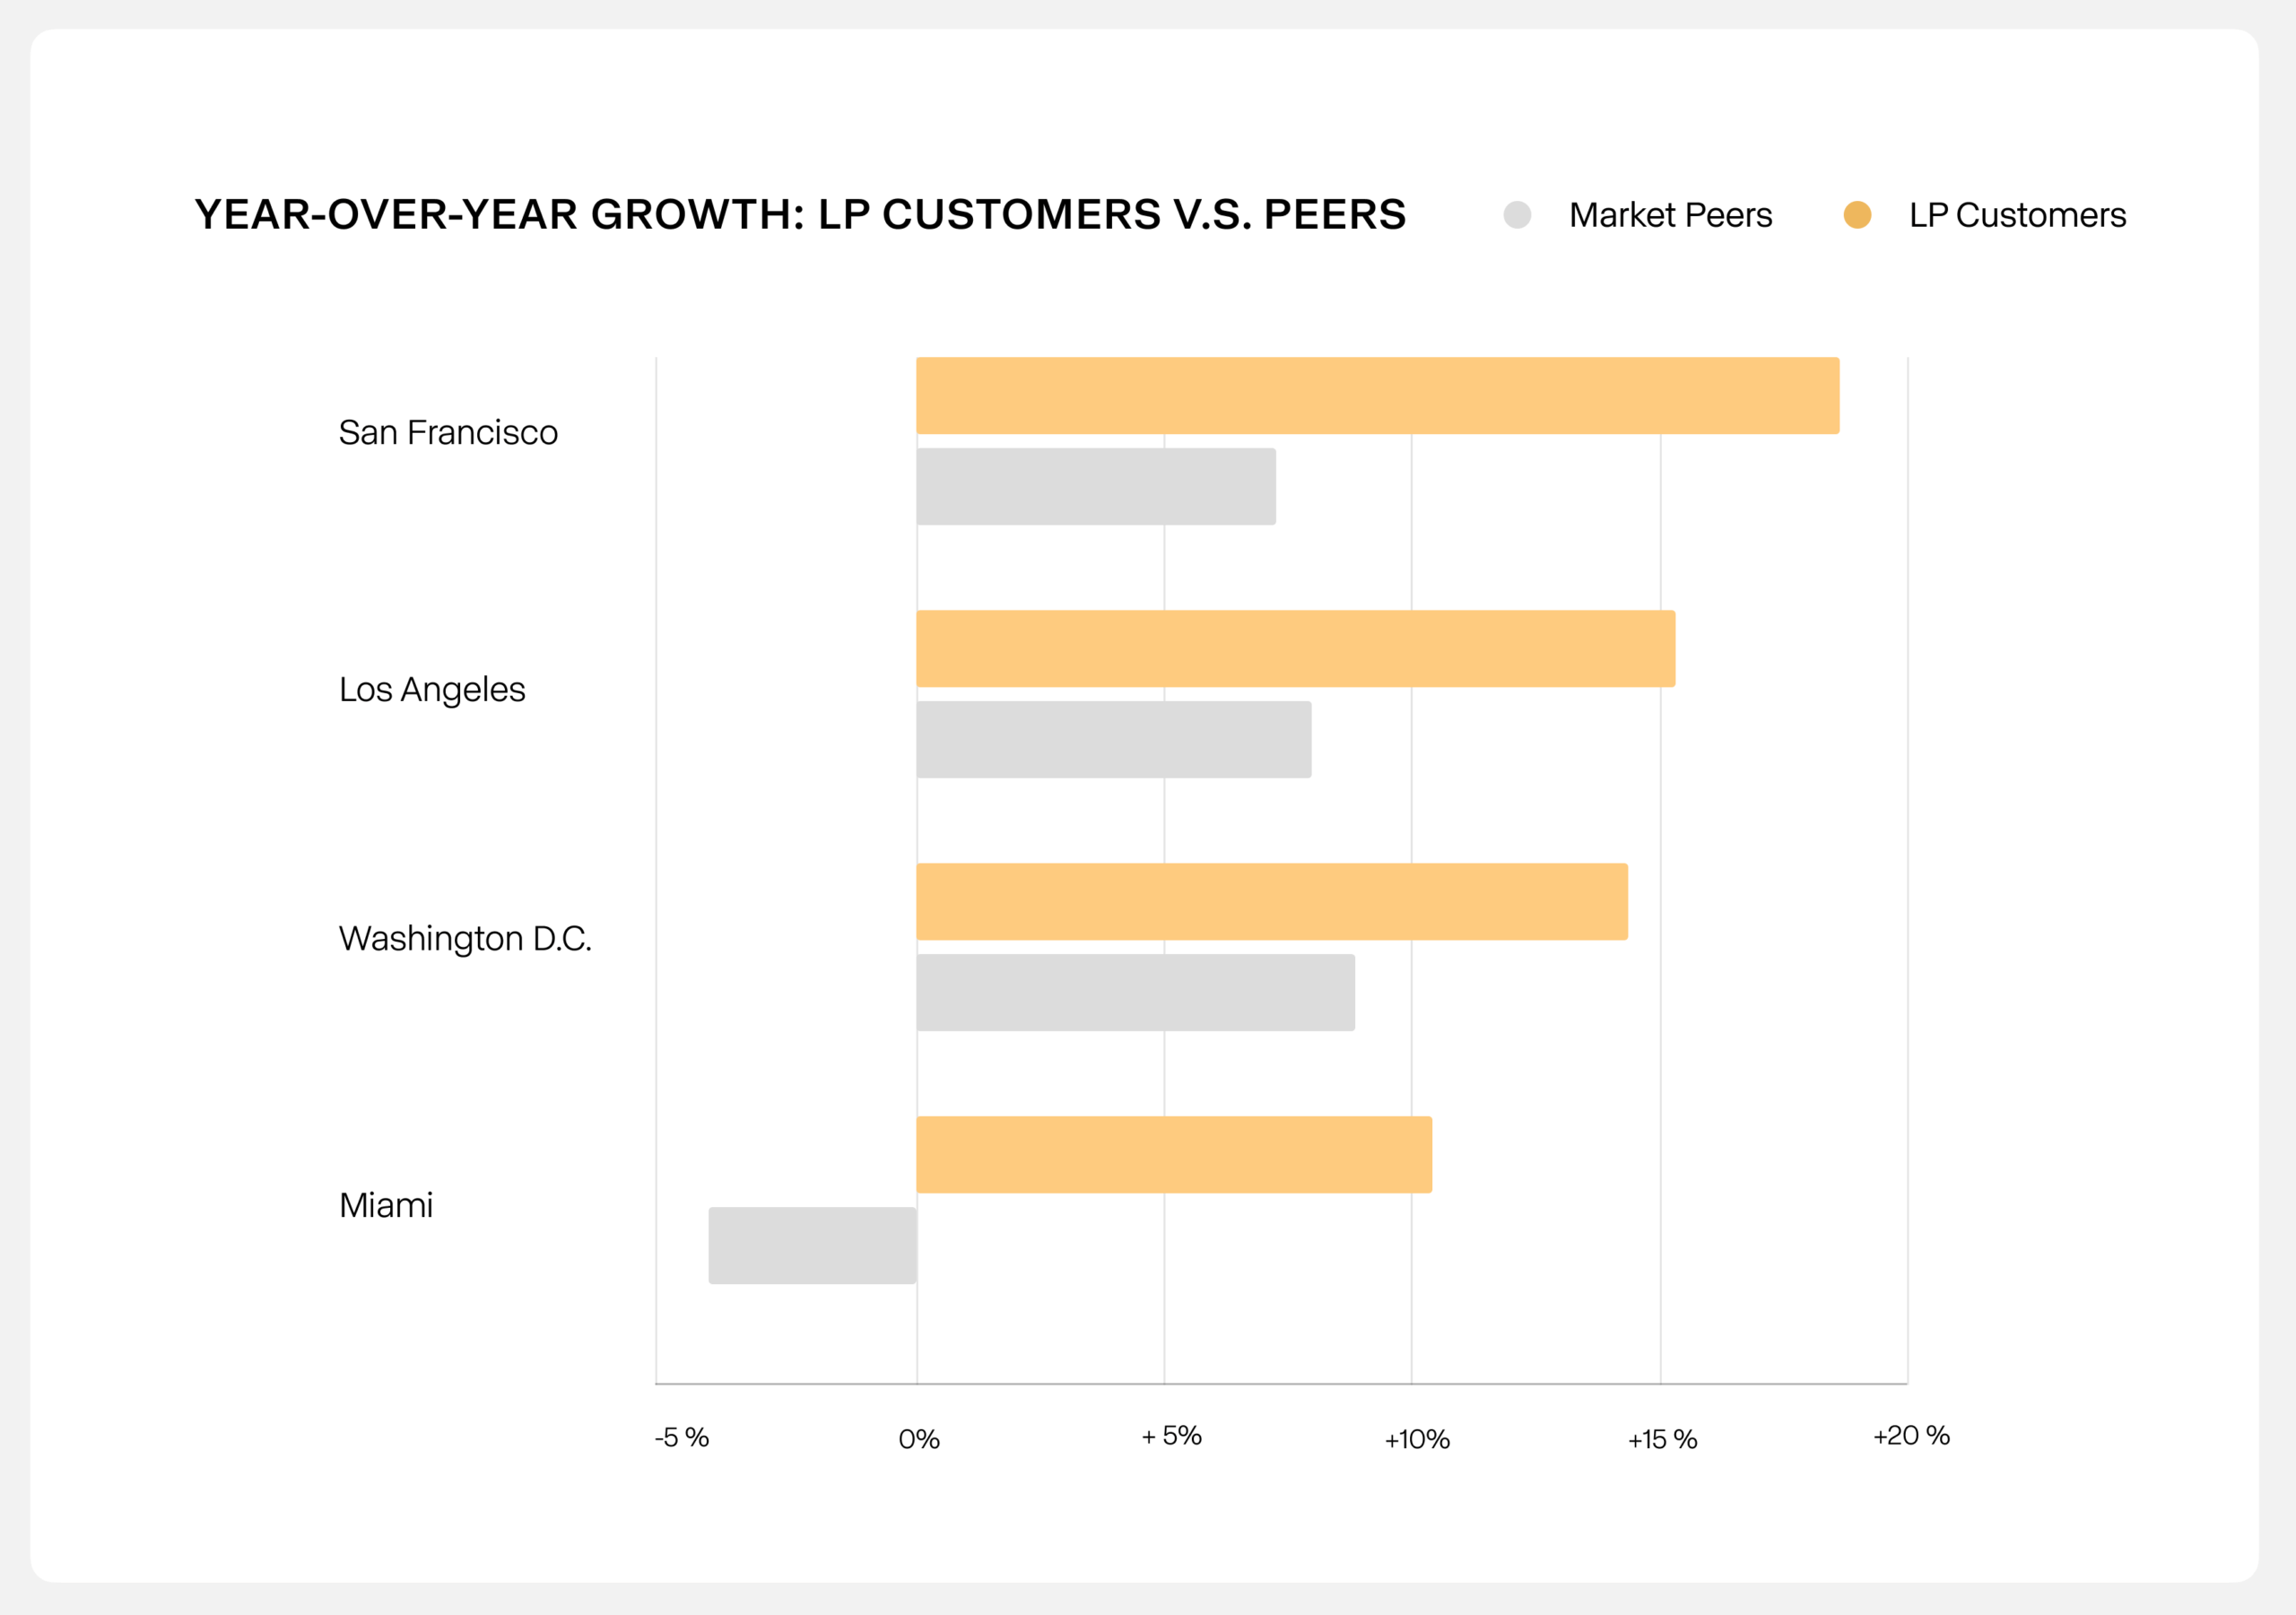
The market share asymmetry is sharpest in America's highest-value cities. In San Francisco, Luxury Presence customers represent 13% of agents but control 28.7% of transaction value. In Los Angeles: 10% of agents, 23.4% of value. Washington, D.C.: 9% of agents, 17.6% of value. Miami: 4% of agents, 16.6% of value.
The top five markets added $14.1 billion in Luxury Presence customer transaction value year-over-year.
Broader market conditions in most of those cities were modest or negative during the same period. The growth came from market share capture, not a rising tide.
Three things driving it
The performance gap is too consistent, present in 95% of markets we analyzed, to come down to one cause. Three factors appear to compound each other.
The first is selection. Top producers seek out premium tools, which means the baseline is already elevated before any platform effect comes into play. The agents who pursue high-quality resources tend to already be operating at a high level. That's worth naming because it's part of the story, not a caveat to it.
The second is compounding. Once those agents are on the platform, existing advantages build on themselves. Stronger brand presence draws higher-value clients. Higher-value clients lead to larger deals. Larger deals fund more focused marketing. The 2.85x value multiplier reflects that cycle running across tens of thousands of agents over two years.
The third is concentration. In markets where Luxury Presence customers control 20 to 30% of transaction value, that density creates its own gravity. Market visibility, referral advantages, and credibility among peers all reinforce each other. Getting into that tier is hard. Once you're there, staying gets easier.
Methodology: How we did this study
This project started with a simple question: do Luxury Presence customers actually perform better than agents who don't use the platform, and if the answer is yes, by how much, and how consistently?
To answer that credibly, we needed a large enough dataset to draw real conclusions, and a comparison group operating under the same market conditions. Neither is trivial to pull together.
For the transaction data, we worked with 78.5 million MLS records across 310 U.S. metro areas, covering a full two years from October 2023 through October 2025. We split that window into two consecutive 12-month periods so we could measure year-over-year change rather than just a snapshot. Snapshots can flatter or mislead. Trends are harder to fake.
For the comparison group, we cross-referenced our customer database of 69,005 active Luxury Presence customers against the 1,081,483 non-Luxury Presence agents operating in the same markets. Every comparison in this report is same-market: Luxury Presence customers are compared only to agents working in the same metro area during the same period. That removes geography as a variable entirely.
Of those 69,005 customers, 53,152 had verifiable MLS transaction activity during the analysis window. The remaining 15,853 were excluded from performance calculations. Most agents in that group use Luxury Presence for marketing but transact primarily off-market, or hadn't yet closed a deal during this specific window. Including estimated activity would introduce noise. Excluding them keeps the numbers grounded.
A few other exclusions are worth knowing about. Markets with fewer than 1,000 total agents or fewer than 10 Luxury Presence customers were removed; the samples are too small to draw reliable conclusions. Off-market and private transactions not recorded in MLS were excluded. Test and internal company accounts were removed.
One data note on Dallas-Fort Worth: we identified an anomaly in that market's year-over-year figures during quality review. Dallas-Fort Worth is excluded from all growth calculations as a result, though it remains in volume and value figures.
MLS matching covered approximately 77% of Luxury Presence customers, consistent with industry norms for agent-level data linkage. The remaining 23% are excluded rather than estimated.
At a sample of 53,152, national-level findings carry a margin of error of plus or minus 0.4% at 95% confidence. Top-50 metro findings carry plus or minus 2 to 5%. Individual market figures vary from plus or minus 5 to 15% depending on Luxury Presence customer penetration in that market. All reported performance advantages exceed 1.5 times the peer baseline, well above the minimum detectable effect at these sample sizes. The advantage held in 95% or more of markets we analyzed.
What it means for you
The question agents ask about any platform is whether it actually moves the needle. Two years of data across 310 markets gives a clear answer: for Luxury Presence customers, it does.
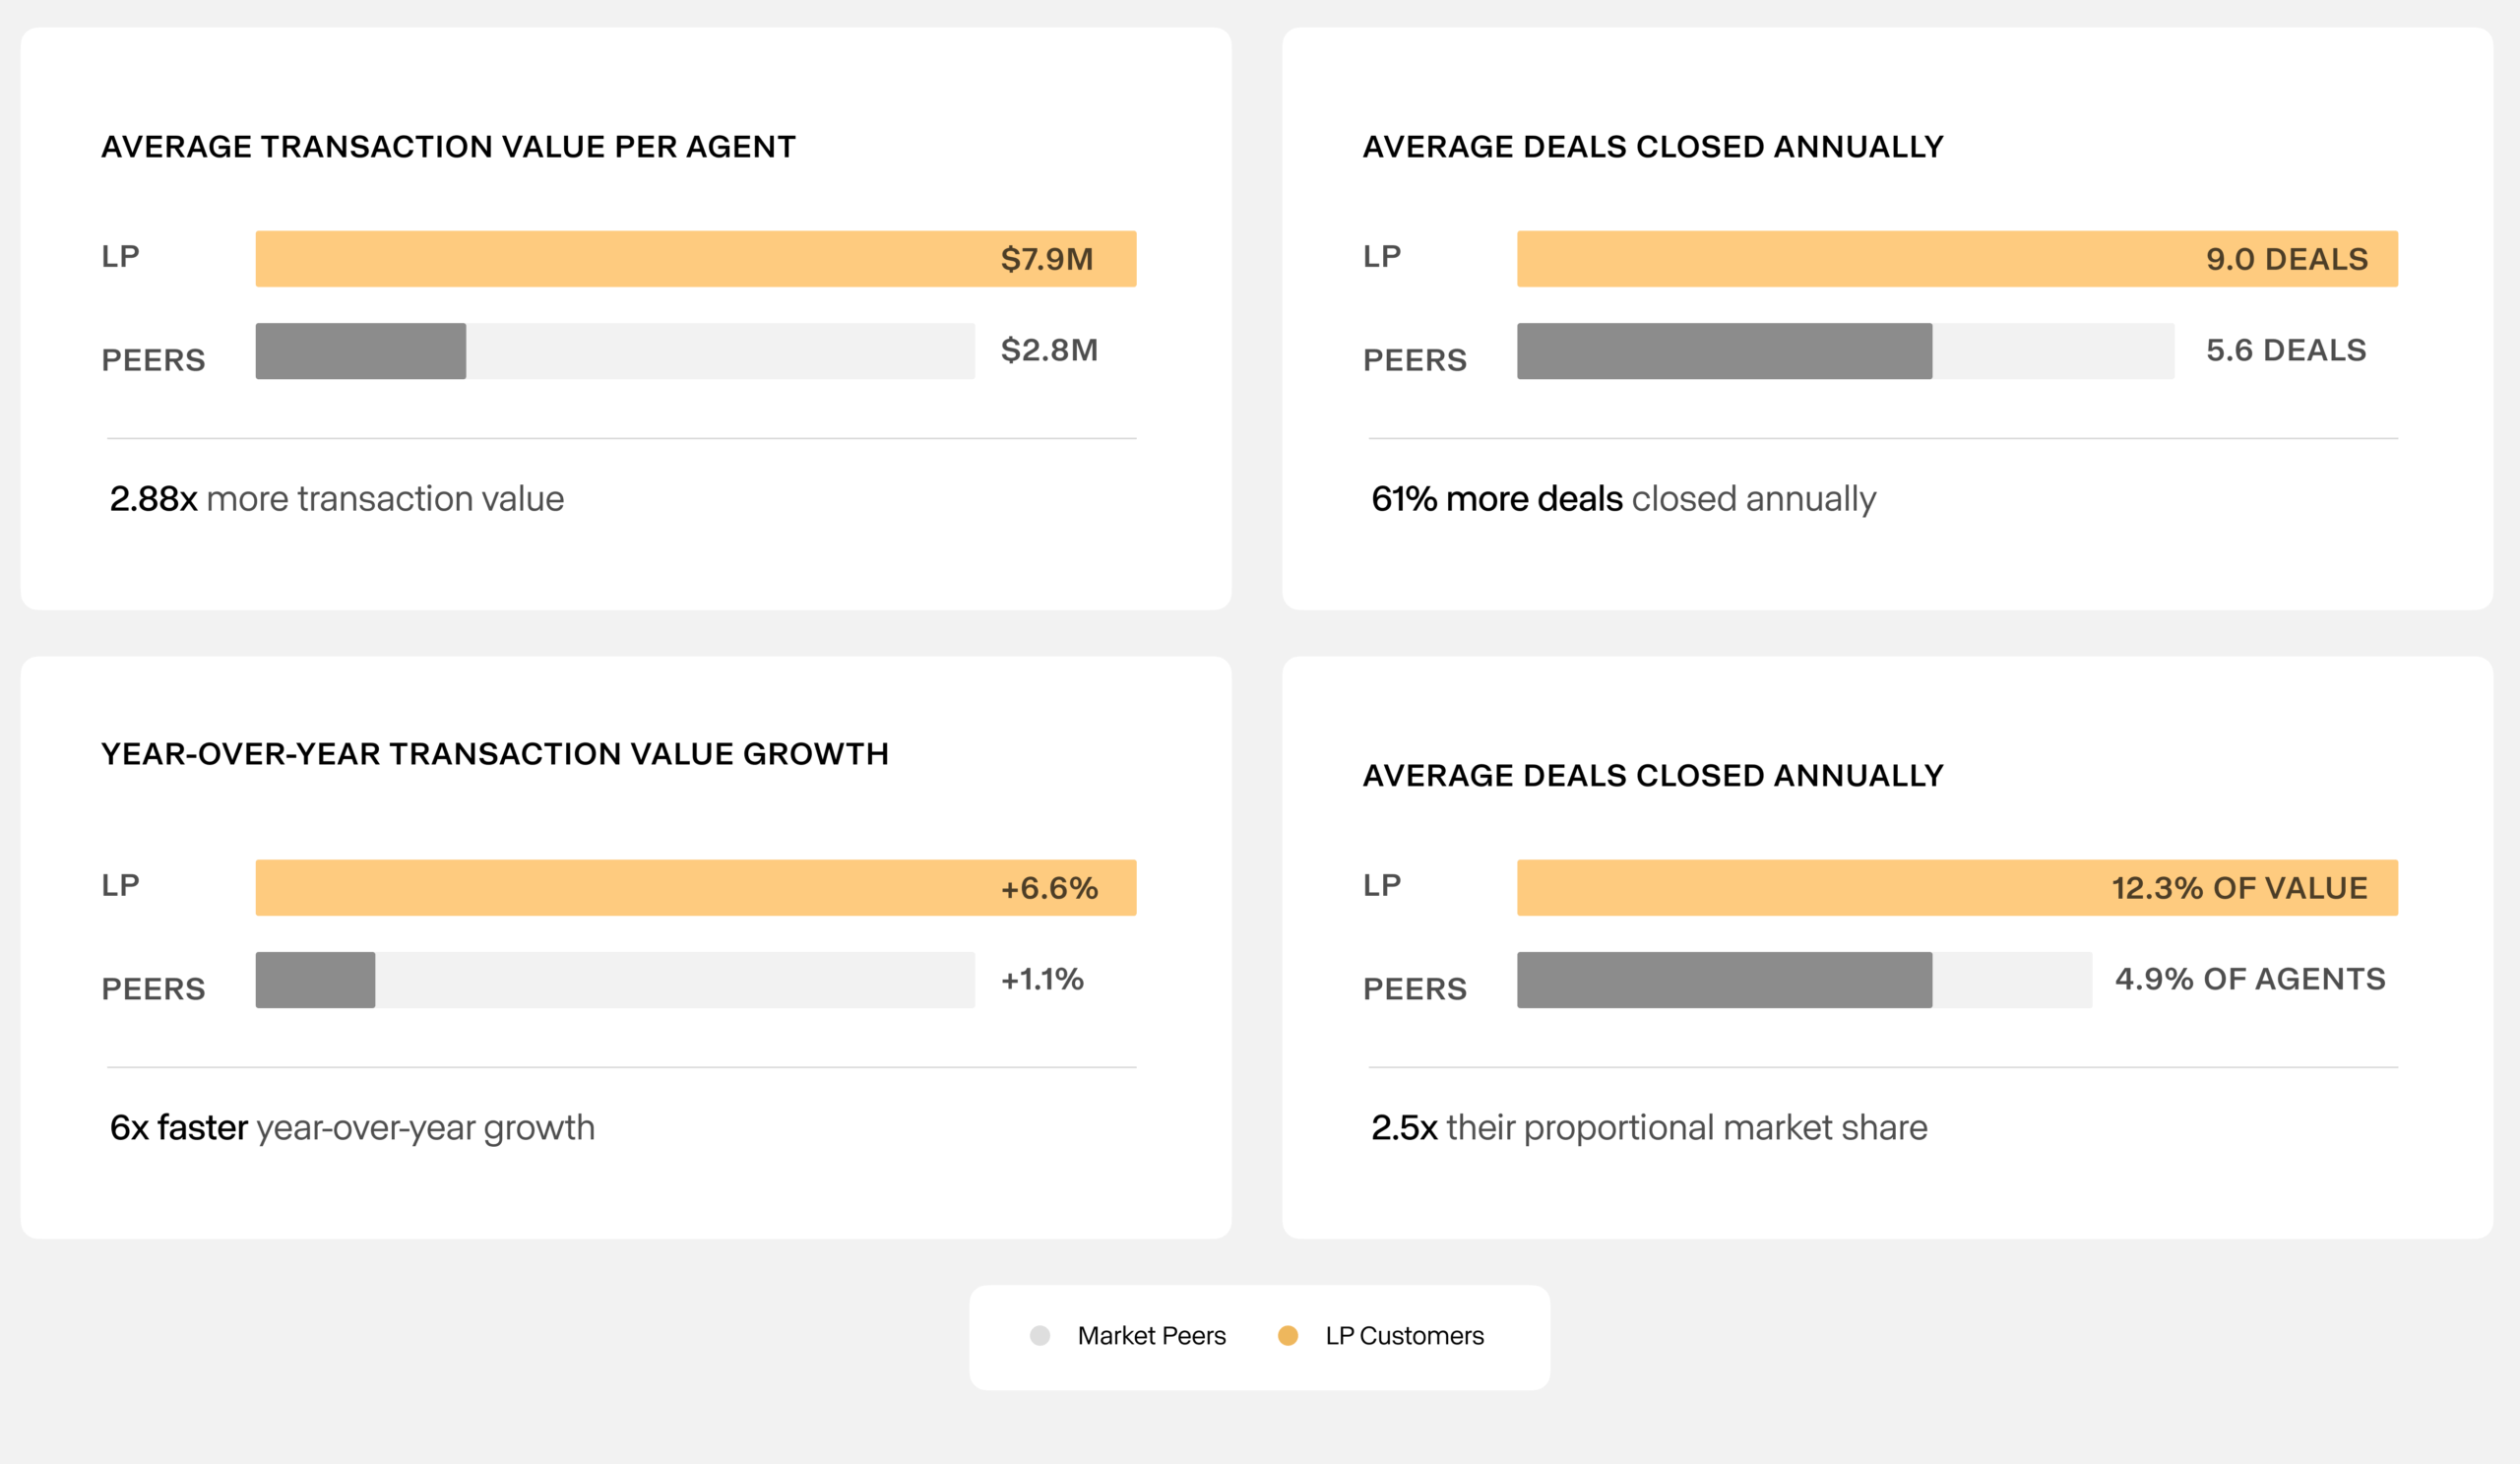
Nearly 3x more transaction value. 60% more deals. Six times faster growth. A market presence 2.5 times larger than their agent count alone would suggest. These numbers held in rising markets, declining markets, major metros, and secondary cities.
The pattern in this data is consistent enough to be meaningful. Across 310 markets, two years, and conditions that ranged from strong growth to real contraction, Luxury Presence customers outperformed their peers. The gap is large enough, and stable enough, to be worth taking seriously.
Analysis conducted November 2025. Data covers October 2023 through October 2025. Sample: 53,152 Luxury Presence customers vs. 1,081,483 market peers across 310+ U.S. metro areas.
Ready to grow?
Turn your content into your best lead source
See how Luxury Presence helps agents turn website visits into closed deals